
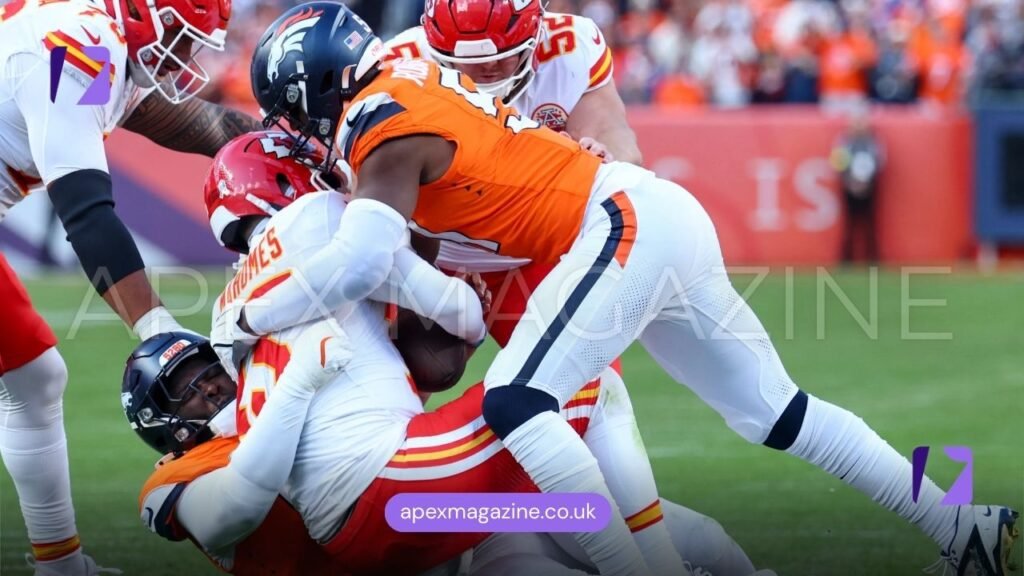
The Kansas City Chiefs vs Denver Broncos matchup on 17 November 2025 delivered a closely fought AFC West contest defined by discipline, tactical execution, and small statistical margins. Rather than explosive scoring, the game unfolded as a strategic battle where both teams focused on controlling possessions and limiting costly mistakes. The final numbers reflect how evenly matched these rivals were across most phases of play.
From total yardage to time of possession, the game stayed balanced, with each team asserting dominance in specific areas. Kansas City leaned on clock control and composure, while Denver showed sharper efficiency through the air. This statistical breakdown provides a clear picture of how performance, rather than flair, shaped the outcome.
- Quick Score Table
- Quick Match Stats Table
- Match Summary and Key Moments
- Kansas City Chiefs: Overall Team Performance
- Denver Broncos: Overall Team Performance
- Quarterback Performance Comparison
- Rushing Game Analysis
- Receiving and Passing Game Impact
- Defensive Performance and Discipline
- Red Zone Efficiency Breakdown
- Special Teams Performance: Field Goals, Punts, and Returns
- Penalties and Game Management
- Time of Possession and Tempo Control
- Comparative Team Stats Analysis
- Impact Players and Tactical Takeaways
- Conclusion
- Frequently Asked Questions
Quick Score Table
| Team | Q1 | Q2 | Q3 | Q4 | Final |
|---|---|---|---|---|---|
| Kansas City Chiefs | 3 | 3 | 7 | 6 | 19 |
| Denver Broncos | 6 | 0 | 7 | 9 | 22 |

Quick Match Stats Table
| Category | Kansas City Chiefs | Denver Broncos |
|---|---|---|
| Total Yards | 311 | 342 |
| Passing Yards | 249 | 283 |
| Rushing Yards | 62 | 59 |
| Turnovers | 1 | 0 |
| Red Zone Efficiency | 1-4 | 1-5 |
| Penalties | 10-69 | 10-147 |
| Time of Possession | 30:31 | 29:29 |
Match Summary and Key Moments
The match progressed at a steady pace, with both teams trading sustained drives rather than quick scores. Kansas City’s ability to maintain possession kept Denver’s offense from staying on the field for extended stretches. At the same time, Denver’s passing efficiency allowed them to generate slightly more total yards over the course of the game.
Key moments emerged in red-zone situations and penalty management. Both teams struggled to fully capitalize inside scoring territory, which kept the scoreline tight throughout. Discipline, field position, and situational awareness played a bigger role than highlight-reel plays.
Kansas City Chiefs: Overall Team Performance
Kansas City finished the game with 311 total yards, reflecting a methodical offensive approach. The Chiefs relied on controlled drives rather than explosive plays, focusing on short to intermediate gains to sustain momentum. This approach helped them dominate possession for 30:31, slightly more than Denver.
Turnover discipline remained a priority, with Kansas City committing one turnover during the game. While their rushing output stood at 62 yards, it primarily served to balance the offense and manage the clock rather than dominate on the ground. Overall, the Chiefs executed a controlled but conservative game plan.
Denver Broncos: Overall Team Performance
Denver recorded 342 total yards, outperforming Kansas City in overall offensive production. The Broncos leaned heavily on their passing game, accumulating 283 passing yards, which allowed them to move the ball efficiently between the 20s. This aggressive approach gave Denver a statistical edge despite similar possession time.
The Broncos protected the football effectively, finishing with zero turnovers. Their rushing game produced 59 yards, closely mirroring Kansas City’s output. Denver’s performance emphasized efficiency and ball security, which proved critical in such a tightly contested matchup.
Quarterback Performance Comparison
Kansas City’s quarterback performance centered on control and decision-making rather than volume. With 249 passing yards, the Chiefs prioritized safe throws that kept drives alive. This approach minimized risk but limited opportunities for explosive gains downfield.
Denver’s quarterback delivered a more assertive passing display, throwing for 283 yards. This higher output allowed the Broncos to stretch the field and apply pressure on Kansas City’s defense. The contrast between cautious efficiency and aggressive execution defined the quarterback battle.
Rushing Game Analysis
Kansas City’s rushing attack totaled 62 yards, functioning primarily as a support system for the passing game. Rather than relying on big runs, the Chiefs used the ground game to maintain balance and control tempo. This strategy aligned with their emphasis on possession.
Denver’s rushing output reached 59 yards, nearly identical to Kansas City’s. The Broncos also treated the run game as a complementary element rather than a focal point. Both teams demonstrated that this matchup would be decided through execution rather than ground dominance.
Receiving and Passing Game Impact
Kansas City’s passing offense accumulated 249 yards, highlighting a steady but restrained aerial approach. The Chiefs focused on timing routes and short completions to maintain rhythm. While effective in sustaining drives, this strategy limited explosive scoring opportunities.
Denver’s receiving corps played a more prominent role, contributing to 283 passing yards. The Broncos consistently gained chunk yardage through the air, which helped them outperform Kansas City in total offensive output. Their receivers proved vital in maintaining offensive pressure.
Defensive Performance and Discipline
Defensively, Kansas City emphasized containment and situational awareness. By forcing Denver to work for yardage and limiting red-zone success, the Chiefs kept the game within reach. Their defense complemented the offense’s possession-based strategy.
Denver’s defense benefited from strong discipline, particularly in turnover prevention. However, penalties became a concern, with 10 penalties for 147 yards, which repeatedly impacted field position. Despite this, the defense remained resilient during key moments.
Red Zone Efficiency Breakdown
Kansas City converted 1 out of 4 red-zone opportunities, reflecting difficulties finishing drives. While they moved the ball effectively between the 20s, execution faltered near the goal line. This inefficiency prevented them from capitalizing fully on possession advantages.
Denver mirrored this struggle, converting 1 out of 5 red-zone trips. Despite generating more total yards, the Broncos also failed to maximize scoring chances. These red-zone inefficiencies kept the game competitive until the final stages.
Special Teams Performance: Field Goals, Punts, and Returns
Special teams impacted field position and scoring opportunities. The Chiefs’ kicker made 2 field goals, contributing crucial points in a tight game. Punting units averaged 45 yards per punt, flipping field position strategically. Kickoff and punt returns generated momentum, including a long return of 32 yards that set up a scoring drive.
The Broncos’ special teams were effective in coverage, limiting return yardage and maintaining defensive positioning. Their kicker converted 1 field goal, and punting units maintained average distance while preventing big returns. Special teams stats emphasize the often-overlooked elements that influence overall performance and match outcomes.
Penalties and Game Management
Kansas City recorded 10 penalties for 69 yards, a manageable figure that did not drastically disrupt momentum. Their penalties tended to stall drives rather than flip field position entirely. Overall, discipline remained relatively stable.
Denver matched the penalty count with 10 infractions, but the impact was far greater at 147 yards. These penalties extended Kansas City drives and negated positive plays. Penalty yardage emerged as one of Denver’s biggest challenges.
Time of Possession and Tempo Control
Kansas City controlled the ball for 30:31, using sustained drives to dictate tempo. This advantage allowed them to rest their defense and limit Denver’s time on offense. Possession control aligned closely with their conservative offensive philosophy.
Denver held the ball for 29:29, only slightly less than Kansas City. Despite trailing in possession, the Broncos maximized their opportunities through efficient passing. The near-equal split highlights how closely matched the teams were.
Comparative Team Stats Analysis
Statistically, Denver held advantages in total yards and passing output, while Kansas City led in possession time. Both teams posted nearly identical rushing numbers, reinforcing how balanced the matchup remained.
Turnovers proved decisive, with Denver committing none compared to Kansas City’s single turnover. However, Denver’s heavy penalty yardage offset this advantage. The numbers illustrate how multiple small factors combined to shape the final performance.
Impact Players and Tactical Takeaways
Kansas City’s impact came from disciplined execution and clock management rather than individual brilliance. Their tactical focus centered on limiting mistakes and controlling tempo throughout the game.
Denver’s key contributors emerged in the passing game, where efficiency and confidence fueled offensive momentum. Despite red-zone struggles, their ability to gain yardage consistently kept them competitive from start to finish.
Conclusion
The Chiefs vs Broncos matchup on 17 November 2025 showcased how closely matched division rivals can be separated by discipline and situational execution. Denver’s statistical edge in total and passing yards contrasted with Kansas City’s superior possession control.
Ultimately, penalties, red-zone efficiency, and turnover management defined the game more than raw production. This contest serves as a clear example of how balanced matchups hinge on execution in critical moments.
Frequently Asked Questions
Who had more total yards in the Chiefs vs Broncos match on 17 Nov 2025?
Denver Broncos recorded more total yards with 342 compared to Kansas City’s 311.
Which team controlled time of possession?
Kansas City Chiefs led time of possession with 30:31, slightly more than Denver’s 29:29.
How did turnovers impact the game?
Kansas City committed one turnover, while Denver protected the ball with zero turnovers, influencing momentum.
Why was red-zone efficiency important in this match?
Both teams struggled in the red zone, converting only one opportunity each, which kept scoring limited.
Which team had more penalty yardage?
Denver Broncos accumulated significantly more penalty yards, totaling 147 compared to Kansas City’s 69.
VISIT MORE: APEX MAGAZINE