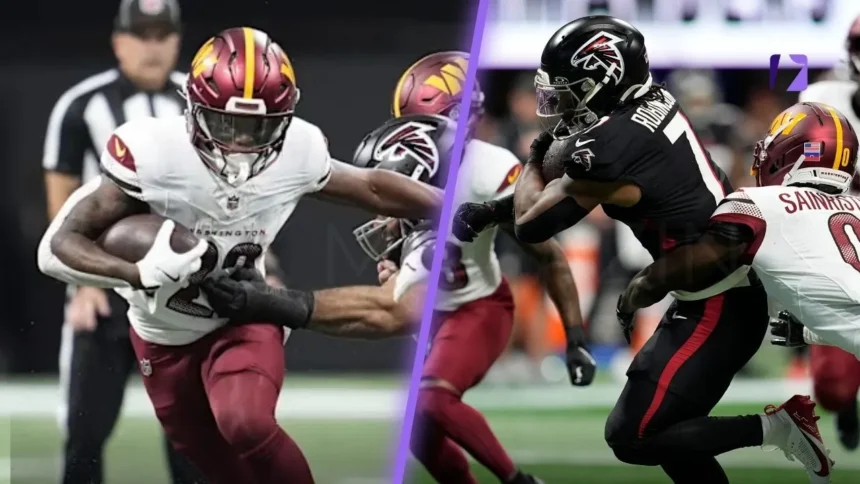
The matchup between the Washington Commanders and the Atlanta Falcons on September 28, 2025, delivered an exciting contest filled with offensive efficiency and contrasting strategies. Both teams entered the game with different strengths, and the final result reflected how execution and consistency can define outcomes in the NFL.
This full breakdown covers player stats, team performance, and key moments that shaped the game. With Atlanta securing a 34-27 victory, the numbers tell a deeper story about dominance in passing, time of possession, and red zone efficiency. Let’s analyze every aspect of this matchup in detail.
- Quick Score Table
- Match Stats Table Stats
- Overall Team Performance Comparison
- First Downs and Offensive Efficiency
- Third and Fourth Down Conversions
- Total Yards and Offensive Output
- Passing Game Breakdown
- Rushing Performance Analysis
- Red Zone Efficiency
- Turnovers and Defensive Impact
- Time of Possession and Game Control
- Key Player Contributions
- Key Moments That Defined the Game
- Conclusion
- Frequently Asked Questions
Quick Score Table
| Team | 1 | 2 | 3 | 4 | Final |
|---|---|---|---|---|---|
| Washington Commanders | 0 | 10 | 6 | 11 | 27 |
| Atlanta Falcons | 10 | 7 | 14 | 3 | 34 |

Match Stats Table Stats
| Category | Washington Commanders | Atlanta Falcons |
|---|---|---|
| 1st Downs | 17 | 24 |
| Passing 1st downs | 8 | 14 |
| Rushing 1st downs | 7 | 9 |
| 1st downs from penalties | 2 | 1 |
| 3rd down efficiency | 1-8 | 6-12 |
| 4th down efficiency | 2-2 | 1-1 |
| Total Plays | 51 | 64 |
| Total Yards | 294 | 435 |
| Total Drives | 9 | 10 |
| Yards per Play | 5.8 | 6.8 |
| Passing | 147 | 307 |
| Comp/Att | 16/27 | 20/26 |
| Yards per pass | 5.1 | 11.4 |
| Interceptions thrown | 1 | 1 |
| Sacks-Yards Lost | 2-9 | 1-6 |
| Rushing | 147 | 128 |
| Rushing Attempts | 22 | 37 |
| Yards per rush | 6.7 | 3.5 |
| Red Zone (Made-Att) | 1-1 | 4-6 |
| Penalties | 6-50 | 5-45 |
| Turnovers | 1 | 1 |
| Fumbles lost | 0 | 0 |
| Interceptions thrown | 1 | 1 |
| Defensive / Special Teams TDs | 0 | 0 |
| Possession | 25:45 | 34:15 |
Overall Team Performance Comparison
From a statistical standpoint, Atlanta outperformed Washington in several key areas. The Falcons recorded 435 total yards compared to Washington’s 294, showing a clear advantage in offensive production. They also ran more plays, with 64 compared to Washington’s 51, allowing them to control the game’s pace.
Washington showed efficiency in certain areas, especially rushing, but struggled to maintain consistency. Atlanta’s balanced attack and ability to sustain drives made the difference. This overall performance highlights why the Falcons secured the win despite a late push from the Commanders.
First Downs and Offensive Efficiency
Atlanta dominated in first downs, recording 24 compared to Washington’s 17. This difference reflects the Falcons’ ability to extend drives and keep their offense on the field. Their passing game contributed significantly, with 14 passing first downs.
Washington managed 8 passing and 7 rushing first downs, showing a more balanced but less effective approach. The inability to convert consistently limited their scoring opportunities. Atlanta’s efficiency in gaining first downs played a crucial role in controlling the game.
Third and Fourth Down Conversions
One of the biggest differences in the game came in third down efficiency. Atlanta converted 6 out of 12 attempts, maintaining drives and building momentum. In contrast, Washington converted only 1 out of 8, which significantly hurt their offensive rhythm.
On fourth downs, Washington showed aggression by converting 2 out of 2 attempts. However, Atlanta’s overall consistency on third downs reduced their need to rely on risky fourth down plays. This contrast highlights how crucial third down performance is in determining game outcomes.
Total Yards and Offensive Output
Atlanta’s offense was highly productive, gaining 435 total yards compared to Washington’s 294. This significant gap demonstrates the Falcons’ ability to move the ball effectively through both passing and rushing plays.
Washington’s offense showed flashes of brilliance but lacked sustained drives. Their total yardage reflects missed opportunities and stalled possessions. Atlanta’s ability to consistently gain yards was a key factor in their victory.
Passing Game Breakdown
The Falcons dominated the passing game with 307 yards, completing 20 of 26 passes. Their average of 11.4 yards per pass indicates explosive plays and efficient execution. This strong passing performance kept Washington’s defense under constant pressure.
Washington, on the other hand, recorded 147 passing yards with 16 completions on 27 attempts. Their average of 5.1 yards per pass shows a more conservative approach. The lack of big passing plays limited their ability to keep up with Atlanta’s offense.
Rushing Performance Analysis
Washington actually outperformed Atlanta in rushing yards, recording 147 yards compared to the Falcons’ 128. They also averaged an impressive 6.7 yards per rush, showing efficiency on the ground.
However, Atlanta compensated with volume, attempting 37 rushes compared to Washington’s 22. This allowed them to control the clock and maintain possession. While Washington was more efficient per run, Atlanta’s overall rushing strategy proved more effective.
Red Zone Efficiency
Red zone performance was another decisive factor in the game. Atlanta converted 4 out of 6 red zone opportunities into touchdowns, demonstrating strong execution when it mattered most.
Washington struggled significantly, converting only 1 out of 1 opportunity. Limited chances and inability to reach the red zone frequently hurt their scoring potential. Atlanta’s efficiency in this area directly contributed to their higher point total.
Turnovers and Defensive Impact
Both teams recorded one interception, and neither team lost a fumble. While turnovers were relatively even, Atlanta managed to capitalize better on their opportunities.
Defensively, neither team scored a touchdown, but Atlanta’s defense played a key role in limiting Washington’s passing game. Their ability to force punts and control field position added to their overall advantage.
Time of Possession and Game Control
Time of possession heavily favored Atlanta, with 34 minutes and 15 seconds compared to Washington’s 25 minutes and 45 seconds. This difference reflects Atlanta’s ability to sustain drives and control the pace of the game.
Washington’s defense spent more time on the field, which likely contributed to fatigue. Atlanta’s dominance in possession allowed them to dictate the flow and limit Washington’s offensive opportunities.
Key Player Contributions
Atlanta’s passing unit stood out as the most impactful group in the game. Their quarterback delivered an efficient performance with high completion rates and significant yardage. Receivers also played a crucial role by making big plays and gaining valuable yards after the catch.
Washington’s rushing attack was a bright spot, with strong performances from their running backs. However, the lack of support from the passing game limited their overall effectiveness. Key players showed potential but needed more consistency.
Key Moments That Defined the Game
The Falcons’ strong start in the first quarter set the tone for the game. By establishing an early lead, they forced Washington to play catch-up. This allowed Atlanta to control the tempo and execute their game plan effectively.
Another key moment came in the third quarter when Atlanta extended their lead. This created pressure on Washington, making their comeback attempt more difficult. These moments highlight how early and mid-game performances can shape final outcomes.
Conclusion
The Washington Commanders vs Atlanta Falcons matchup showcased a clear contrast in offensive efficiency and game control. Atlanta’s dominance in passing, time of possession, and red zone efficiency ultimately secured their 34-27 victory.
While Washington showed strength in rushing and late-game effort, their struggles in passing and third down conversions proved costly. This game serves as a strong example of how balanced offense and consistent execution lead to success in the NFL.
Frequently Asked Questions
Who won the Washington Commanders vs Atlanta Falcons game?
The Atlanta Falcons won the game with a final score of 34-27.
Which team had more total yards?
Atlanta led with 435 total yards compared to Washington’s 294.
How did the passing game compare?
Atlanta dominated with 307 passing yards, while Washington managed 147.
What was the key factor in Atlanta’s win?
Strong passing performance, better third down efficiency, and longer possession time were key factors.
Did Washington perform well in any area?
Yes, Washington showed strong rushing efficiency with 6.7 yards per carry.
VISIT MORE: APEX MAGAZINE